Academic and research
How to calculate standard deviation
The standard deviation tells you how far values typically sit from their mean. You will find the mean, measure each value's distance from it, average the squared distances and take the square root, and learn when to divide by n − 1 instead of n.
The standard deviation is pulled up by outliers. With strongly skewed data, report the median and the range alongside it.
Open Standard deviation calculatorContents
Open the Standard deviation calculator on cv.cm
Paste your numbers, one list, separated by spaces, commas or new lines. The example is 2, 4, 4, 4, 5, 5, 7, 9.
Open Standard deviation calculatorFind the mean
Add the values and divide by how many there are: 40 ÷ 8 = 5.
Square each distance from the mean
Subtract the mean from every value and square the result: 2 − 5 = −3 gives 9, 4 − 5 = −1 gives 1, and so on. Squaring stops the negatives from cancelling the positives. The squares add up to 32.
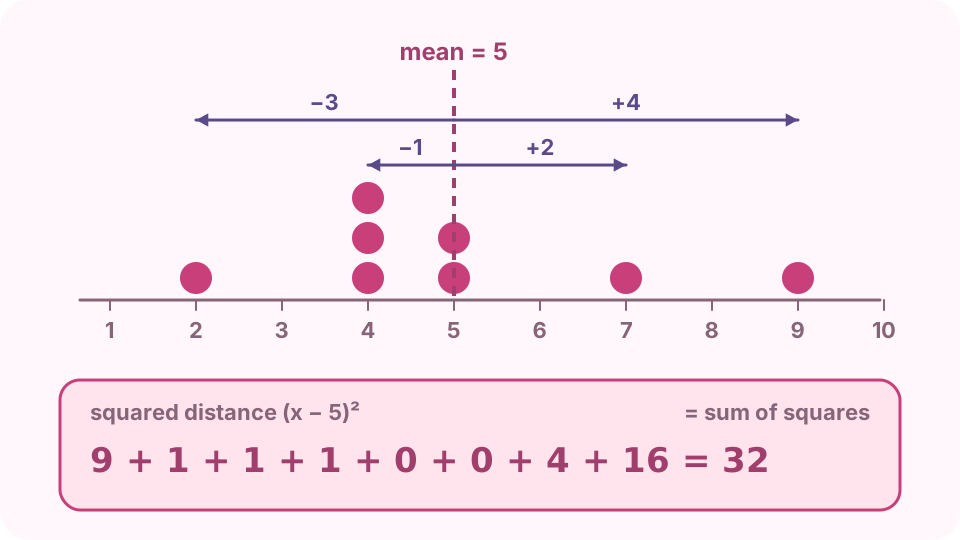
Each value's distance from the mean of 5; the squared distances add up to 32. Divide by n − 1 or n
For a sample from a larger group divide by n − 1: 32 ÷ 7 = 4.571 is the sample variance. Only when you have every member of the group divide by n: 32 ÷ 8 = 4 is the population variance.
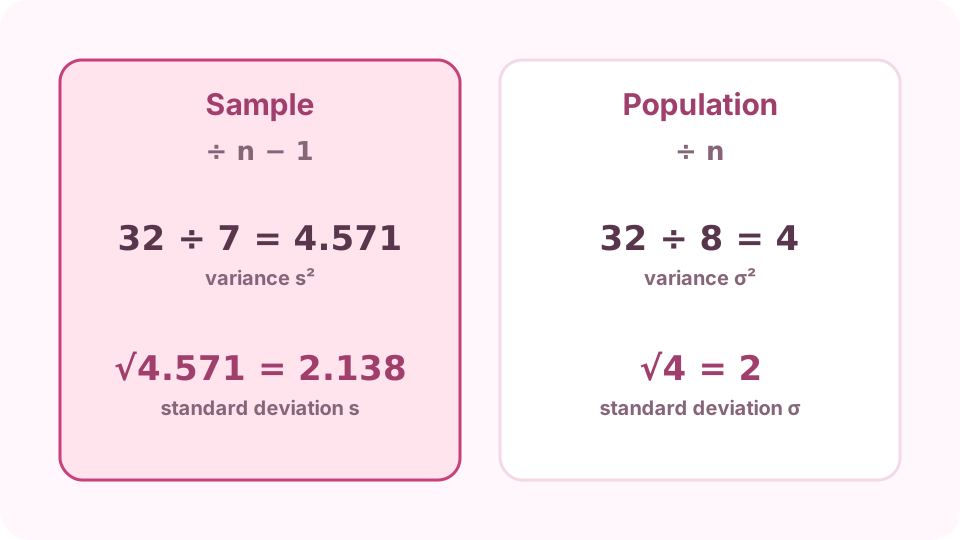
Divide the sum of squares by n − 1 for a sample or n for a population, then take the square root. Take the square root
The square root of the variance is the standard deviation: √4.571 = 2.138 for the sample, √4 = 2 for the population. It is in the same units as your data.
Read and report it
Report the mean with it: M = 5.00, SD = 2.14. The standard error of the mean is SD ÷ √n = 0.76; it is what confidence intervals use. The calculator's table shows every step.
FAQ
What is the formula for standard deviation?
s = √(Σ(x − x̄)² ÷ (n − 1)) for a sample and σ = √(Σ(x − μ)² ÷ n) for a population: the square root of the average squared distance from the mean.
Why divide by n − 1 for a sample?
A sample's own mean sits closer to its values than the true population mean does, so dividing by n would underestimate the spread. Dividing by n − 1 (Bessel's correction) makes up for it.
What is a good standard deviation?
There is no good or bad value on its own. Compare it with the mean (the coefficient of variation) or with other groups measured on the same scale.
What is the difference between standard deviation and standard error?
The standard deviation describes the spread of individual values. The standard error (SD ÷ √n) describes how precisely the sample mean estimates the population mean.
How do I find standard deviation in Excel or Google Sheets?
Use STDEV.S for a sample and STDEV.P for a population (STDEV and STDEVP in older versions).