Academic and research
How to find a p-value
Every common test ends in a statistic (z, t, chi-square or F) that has to be turned into a p-value. You will choose the distribution and tails, read the p-value, compare it with α, find critical values and avoid the usual misreadings.
A p-value is not the probability that the null hypothesis is true, and a small p-value does not mean a large or important effect. Always report an effect size as well.
Open P-value calculatorContents
Open the P-value calculator on cv.cm
Choose p-value from a statistic, or critical value from α if you want the cut-off instead.
Open P-value calculatorPick the distribution
z for large-sample tests of means and proportions, t for t-tests and regression coefficients, chi-square for tables and goodness of fit, F for ANOVA and comparing variances.
Enter the statistic and degrees of freedom
z needs no degrees of freedom. t needs one (n − 1 for one sample), chi-square one, and F two: the numerator and the denominator, for example 2 and 27 in a three-group ANOVA with 30 people.
Choose the tails
Two-tailed tests a difference in either direction and is the usual choice. When the effect goes the predicted way, a one-tailed p is half as large; it needs a reason stated in advance. Chi-square tests of tables and fit, and the F test in ANOVA, use the right tail.
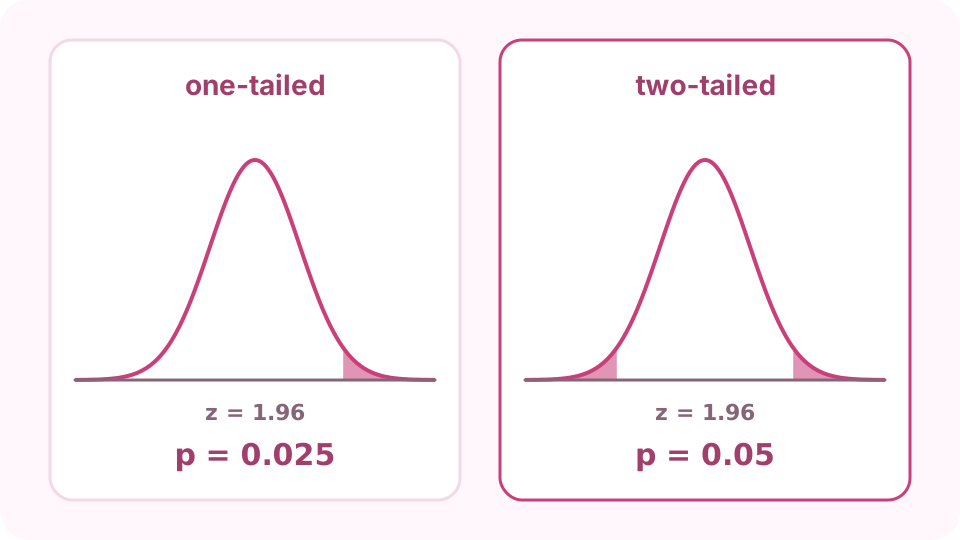
The same z = 1.96 one-tailed and two-tailed: one tail gives p = .025, two give .05. Compare p with α
z = 1.96 two-tailed gives p = .05: the two shaded tails hold 2.5 % each. If p is below your α (usually .05), the result is statistically significant; the calculator also marks .1, .01 and .001.
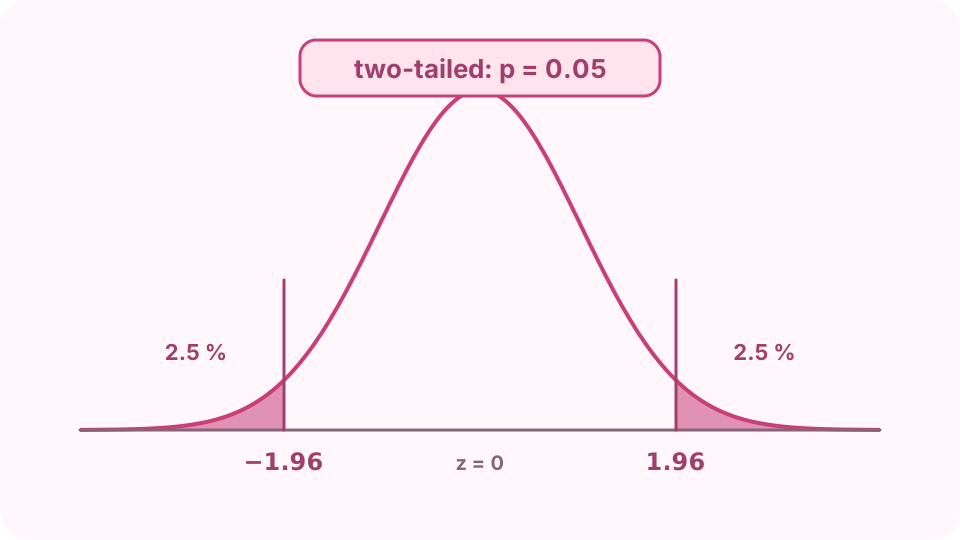
Two-tailed p-value for z = 1.96: the two shaded tails hold 2.5 % each, 5 % together. Find a critical value
Switch to critical value from α: at α = .05 two-tailed it is ±1.96 for z and ±2.228 for t with 10 df; for chi-square with 1 df it is 3.84. Your statistic must pass it to be significant.
FAQ
What is a p-value?
The probability of a result at least as extreme as yours if the null hypothesis were true. A small p-value means your data would be unusual under the null hypothesis.
Is p < .05 always significant?
.05 is a convention, not a rule. Some fields use .01 or .005, and with very large samples tiny, unimportant differences become significant.
How do I get a p-value from a t-score?
Choose t, enter the t value and its degrees of freedom, and pick one or two tails. The calculator gives the area of the t curve beyond your value.
What is the difference between a p-value and a critical value?
The p-value comes from your data; the critical value comes from α. p < α and |statistic| > critical value are the same decision.
How do I report a p-value in APA style?
Give the exact value to two or three decimals without a leading zero (p = .032), and write p < .001 for anything smaller.