Math and school
How to graph a function online
A graph shows at a glance where a function is positive, where it turns and where it crosses zero. You will type a function the way a calculator reads it, choose a good window, read values off the curve and find its zeros and crossings.
Trigonometric functions use radians here, as in most graphing tools: sin(x) crosses zero at multiples of π ≈ 3.14, not at 180.
Open Graphing calculatorContents
Open the Graphing calculator on cv.cm
The page starts with two examples, y = x^2 − 2 and y = sin(x), so you can see how a curve and its points look before typing your own.
Open Graphing calculatorType the function the calculator's way
Write powers with ^ (x^2), roots as sqrt(x), absolute values as abs(x) or |x|, and use brackets for anything that belongs together: 1/(x + 1) is not 1/x + 1. 2x and 3(x + 1) multiply without a × sign.
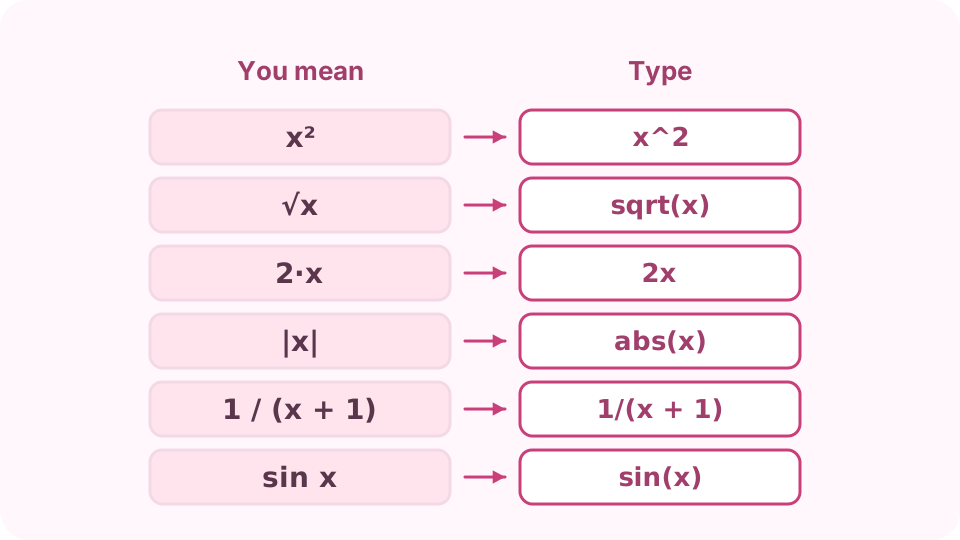
Type what you mean, the way the calculator reads it. Add more functions to compare
Add a function gives a new row in its own colour, up to six. Untick a row to hide its curve without deleting what you typed.
Set a good window
Drag to move and use the mouse wheel, a pinch or the + and − buttons to zoom. Large values need a wider view: y = x^3 at x = 10 is 1,000. Reset returns to −10 to 10.
Read zeros, intercepts and crossings
Under the graph the calculator lists where each curve crosses the x-axis (its zeros), where it crosses the y-axis, and where two curves meet. For y = x^2 − 2 the zeros are ±1.4142136, which is ±√2.
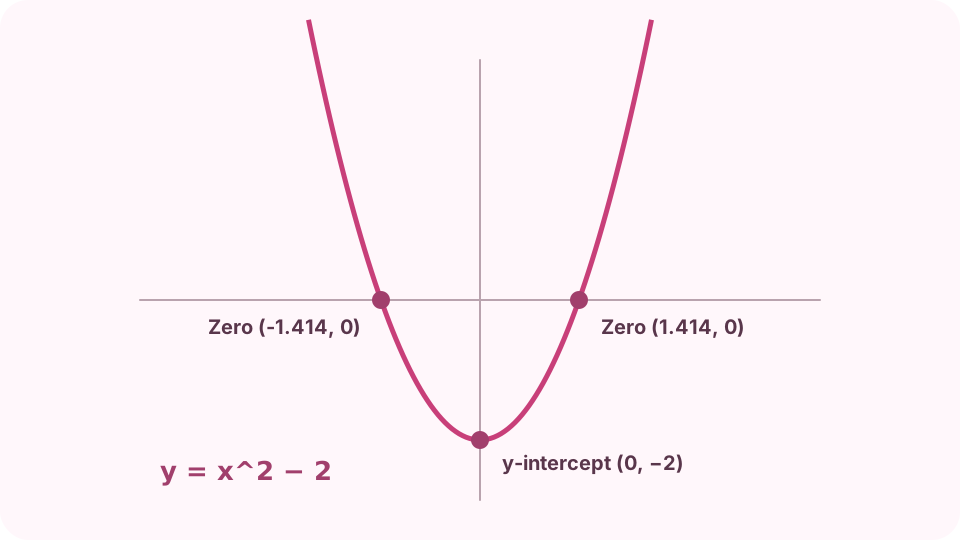
Zeros are where the curve meets the x-axis. Trace values and save the picture
Point at the graph, or tap it, to read x and each function's value there. Download PNG saves the graph for homework or notes.
FAQ
How do I graph y = mx + b?
Type the line with numbers in place of m and b, for example 2x + 1. The slope is how steep it is; b is where it crosses the y-axis.
Why does tan(x) show breaks?
tan(x) has no value at π/2 and every π after it, where it shoots off to infinity. The calculator leaves a gap there instead of drawing a false vertical line.
Why does sqrt(x) stop at zero?
The square root of a negative number is not a real number, so the curve has no points left of x = 0. ln(x) and log(x) stop there too.
How do I find where two graphs meet?
Type both functions. Their crossings in the current view are listed under the graph with both coordinates.
Can I plot x = 3 or a circle?
Not directly: each row is y as a function of x. For a circle of radius 2, plot sqrt(4 − x^2) and −sqrt(4 − x^2).