Academic and research
How to do a chi-square test of independence
A chi-square test of independence asks whether two categorical variables are related, for example whether preference differs between two groups. You will build the table, compute the expected counts, add up the test statistic, find the p-value and check that the test is valid.
Enter counts of people or things, never percentages or means. Each person must appear in only one cell.
Open Chi-square calculatorContents
Open the Chi-square calculator on cv.cm
Choose Independence for a table of two variables, or Goodness of fit for one variable against expected shares.
Open Chi-square calculatorEnter the contingency table
Set the rows and columns and type the observed counts. The example has two groups (rows) and two answers (columns): 20 and 15 in the first row, 30 and 35 in the second, 100 people in all.
Work out the expected counts
If the variables were unrelated, each cell would hold row total × column total ÷ grand total. The first cell: 35 × 50 ÷ 100 = 17.5. The calculator lists all of them.
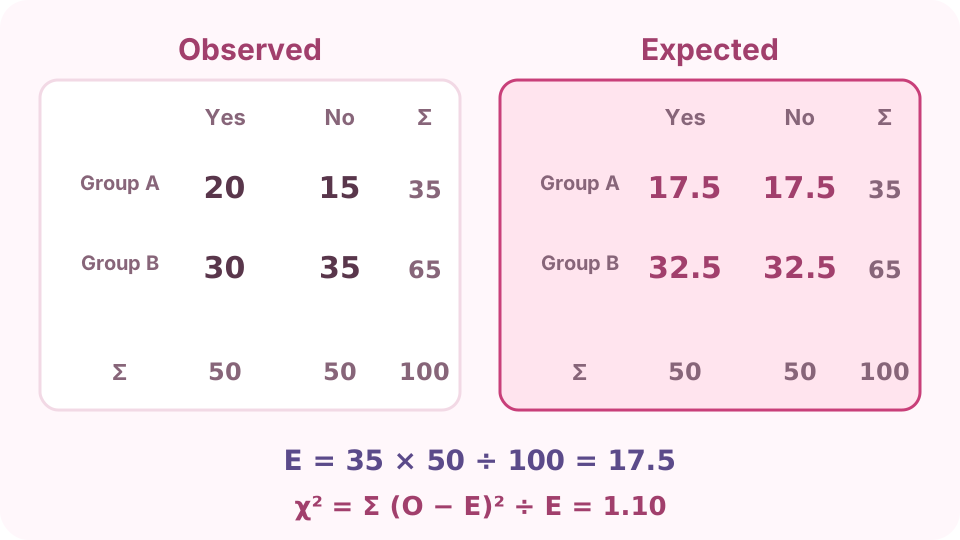
Observed counts next to the counts expected if the two variables were unrelated. Add up (O − E)² ÷ E
For each cell, square the gap between observed and expected and divide by expected, then add the four results: χ² = 1.10. The degrees of freedom are (rows − 1) × (columns − 1) = 1.
Read the p-value
χ²(1) = 1.10 gives p = .295, far above .05, so there is no evidence of a relationship. Cramér's V = .10 shows the association is weak in any case. Significance needs χ² above 3.84 at 1 df.
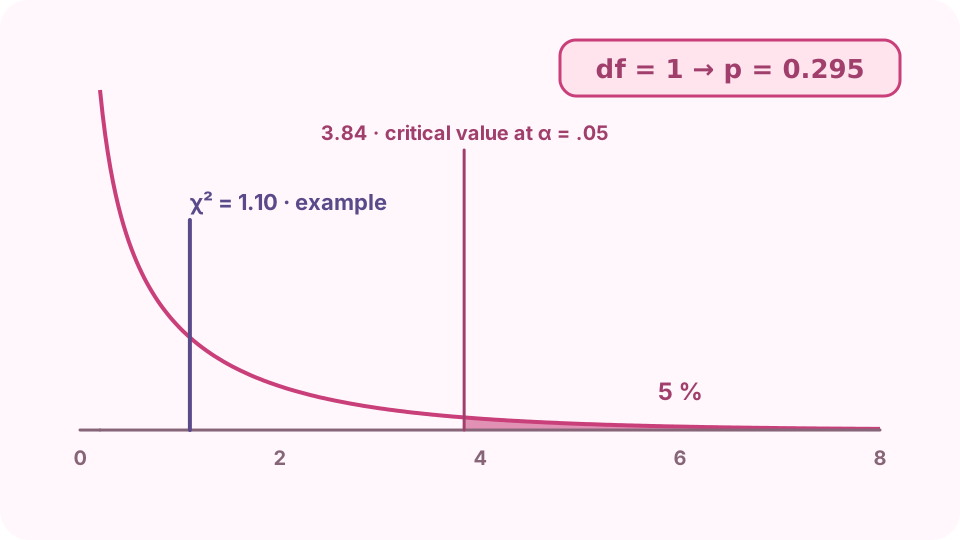
The chi-square distribution with 1 degree of freedom: 1.10 is well below the 3.84 needed at α = .05. Check the expected counts and report
The test is reliable when no more than 20 % of expected counts are below 5 and none is below 1; for a small 2 × 2 table use Fisher's exact test. Report it as χ²(1, N = 100) = 1.10, p = .295.
FAQ
What does a chi-square test tell you?
Whether the pattern of counts in a table differs from what you would expect if the variables were unrelated (independence) or if the categories followed given shares (goodness of fit).
How do I calculate degrees of freedom for chi-square?
(rows − 1) × (columns − 1) for a test of independence, and categories − 1 for goodness of fit.
What is Yates' correction?
A continuity correction for 2 × 2 tables that makes χ² slightly smaller. It is conservative; many statisticians now prefer Fisher's exact test for small tables instead.
What is Cramér's V?
An effect size for the strength of the association, from 0 to 1. For a 2 × 2 table about .1 is small, .3 medium and .5 large.
Can I use percentages in a chi-square test?
No. The test needs the actual counts; percentages hide the sample size and give a wrong result.